China’s solar market is expanding rapidly, but every mounting system still faces one unforgiving force: wind. The IEA PVPS Trends 2024 report recorded more than 400 GW of new photovoltaic capacity worldwide in 2023. Each installation adds another structural question.
How to calculate wind load for solar panel mounting systems begins with site data, not panel dimensions. Designers should verify basic wind speed, terrain category, building height, roof exposure, panel tilt, edge zones, and local pressure coefficients. In China, GB 50009 provides the core wind-load framework. ASCE 7-22 offers useful international comparison. NREL guidance also stresses that array configuration and attachment details can strongly influence uplift.
Small details matter. A loose clamp can become a failure point. A roof corner can experience higher suction. Open farmland behaves differently from a dense urban street. The calculation must follow the actual site.
Dr. Peter Irwin, a recognized wind-engineering specialist, explains the practical risk: “Wind loading must be assessed for the structure, not guessed from a single wind speed.” That principle deserves attention. Product brochures sometimes simplify the process too much.
A reliable design should combine code-based calculations, structural analysis, validated component data, and qualified field inspection. Engineers should document assumptions clearly, including whether snow, seismic, or combined load cases govern. Mistakes happen. The honest response is to review them before installation.
This guide examines China’s leading solar mounting practices, calculation steps, and common design gaps. It aims to make wind-load decisions more transparent, practical, and defensible.
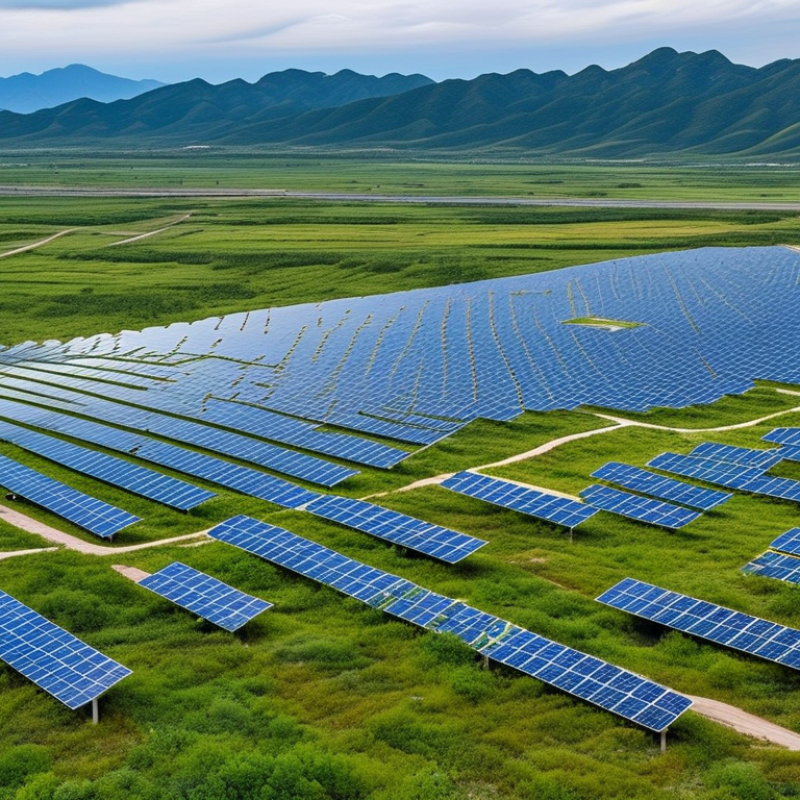
Define Site Wind Speed Using China’s GB 50009 and Regional Climate Data
China Top Solar Panel Mounting: How to Calculate Wind Load
Defining site wind speed is the foundation of a reliable solar mounting design in China. GB 50009 provides regional basic wind speeds for specific return periods and exposure conditions. These values usually represent a 10-minute average wind speed measured at 10 meters above open ground. Confirm the applicable city, county, altitude, and terrain category before using the map value.
Regional climate data can improve the assessment, especially near coastlines, mountains, typhoon paths, and open agricultural land. Check records from qualified meteorological sources, not only online weather applications. Compare station elevation, observation period, instrument position, and data quality with the project location. A short record may hide an unusual but important storm pattern.
Do not guess.
For preliminary calculations, the selected basic wind speed can be converted into reference wind pressure. The design should then consider height, terrain roughness, topographic effects, and local pressure coefficients for panels and supports. A rooftop array may experience different suction from a ground-mounted array. Edge and corner zones also deserve closer attention. In practice, engineers should document every adjustment from GB 50009, including regional data conflicts and conservative choices. Records can disagree. That is a reason to investigate, not to select the lower number. A site-specific review by a qualified structural professional remains necessary when measurements are limited or the terrain changes sharply.
China Solar Panel Mounting: Representative Wind Pressure by Region
Representative basic wind speeds are shown for selected locations using the regional wind-speed framework of China’s GB 50009. The reference velocity pressure is calculated as q = 0.5ρV², with air density ρ = 1.25 kg/m³.
Values represent indicative 50-year return-period basic wind speeds based on regional GB 50009 classifications and are intended for preliminary comparison. Final solar mounting design should use the exact site wind zone, terrain category, height coefficient, shape coefficient, exposure conditions, and local meteorological data. A simplified design action can be expressed as Fw = βzμsμzw0A.
Convert Basic Wind Speed into Design Pressure with q = 0.613V²
China Top Solar Panel Mounting: How to Calculate Wind Load
Convert Basic Wind Speed into Design Pressure with q = 0.613V². Here, q is velocity pressure in pascals, and V is wind speed in metres per second. For example, a 35 m/s wind speed produces q = 0.613 × 35², or about 751 Pa. At 50 m/s, pressure rises to approximately 1.53 kPa. Small speed changes matter greatly because the value is squared. The IRENA Renewable Capacity Statistics 2024 reported global solar capacity above 1,400 GW at the end of 2023. More installations mean more roofs and ground systems facing local wind exposure. However, q alone is not the final design pressure. ASCE 7-22 and EN 1991-1-4 require exposure, height, gust, topographic, and pressure coefficients.
A practical design review should check uplift on clamps, rails, posts, and anchors. Roof edges often experience stronger suction than central zones. A 0.75 kPa pressure can become much higher after applying local coefficients. This is where mistakes occur. I have seen calculations use average wind speed instead of the specified basic wind speed. That shortcut is unsafe. Connection stiffness, panel gaps, tilt angle, and uneven terrain also affect results. Field conditions rarely look perfect.
Tips:
Confirm the wind-speed source and return period. Keep units consistent. Use V in m/s. Check both downward pressure and uplift. Compare calculated forces with structural testing and the applicable local code. If the input map or exposure category seems unclear, stop and review it with a qualified engineer.
Select Exposure, Height, Topographic, and Gust Factors for the Array
Wind load begins with four choices: exposure, height, topographic, and gust factors. These inputs describe how wind reaches the array, not merely how strong it feels. For a rooftop project, identify surrounding terrain carefully. Open farmland, coastal edges, dense cities, and sheltered valleys behave differently. Do not treat every site as “open.” Buildings, trees, and unfinished structures can change airflow over the modules.
Select exposure from the governing structural standard and confirm it with a site survey. Use the array height above ground or roof, measured consistently across the calculation. A small height error can increase pressure, especially where wind speed rises above rough surfaces. Topographic factors may apply near ridges, escarpments, or isolated hills. They should not be added just because a site looks elevated. Check the slope shape, wind direction, and distance from the crest. For flat terrain, the value may be neutral.
The gust factor converts fluctuating wind into a design effect for the mounting system. Keep it consistent with the selected standard, structural model, and load combination. Then calculate positive pressure, suction, edge zones, and corner effects separately. Corners often need closer attention. I would record each assumption beside the result. That makes review easier and exposes weak inputs. One practical mistake is copying factors from a nearby project without checking terrain. Wind studies are imperfect, so conservative judgment and local engineering review remain necessary.
China Top Solar Panel Mounting How to Calculate Wind Load - Select Exposure, Height, Topographic, and Gust Factors for the Array
Basic calculation sequence:
Determine the design wind speed, select the exposure category, calculate the velocity-pressure coefficient at the array height, apply the topographic and directionality factors, and then calculate design wind pressure.
Reference equations:
qz = 0.5ρVz2;
qh = 0.613KzKztKdV2 kPa when V is in m/s and standard air density is used.
1. Required Wind-Load Input Parameters for a Solar Array
| Parameter |
Typical Design Value or Selection |
Unit |
How It Is Used |
Engineering Note |
| Basic wind speed, V |
30, 35, 40, or 45 |
m/s |
Starting wind-speed input for calculating velocity pressure. |
Use the governing regional wind-speed map and the applicable national or local design standard for the project location. |
| Air density, ρ |
1.225 |
kg/m³ |
Used in q = 0.5ρV². |
This is the commonly used standard sea-level air density. Local altitude, temperature, and design requirements may justify another value. |
| Array reference height, z |
4.6, 9.1, or 13.7 |
m |
Used to select or calculate Kz. |
These values correspond approximately to 15, 30, and 45 ft. Use the height required by the governing standard and the critical windward or leeward surface. |
| Exposure category |
B, C, or D |
Category |
Defines the terrain roughness and vertical wind-speed profile. |
Exposure selection is based on the upwind terrain in the sector producing the critical wind direction. |
| Topographic factor, Kzt |
1.00 for essentially flat terrain |
Dimensionless |
Amplifies wind speed near isolated hills, ridges, or escarpments when applicable. |
Do not assume 1.00 on elevated terrain. Calculate Kzt using the project topography and the applicable standard. |
| Directionality factor, Kd |
0.85 for many open or lattice-type wind-sensitive elements |
Dimensionless |
Accounts for the reduced probability of the design wind occurring from the most unfavorable direction. |
Use the exact value assigned to the applicable structural component and load case; do not transfer values between standards without verification. |
| Gust-effect factor, G |
0.85 for a typical rigid structure assumption |
Dimensionless |
Converts mean wind pressure into an equivalent gust response for rigid components. |
Flexible arrays, long support members, or dynamically sensitive systems may require a calculated gust-response procedure. |
| Pressure coefficient, Cp |
Project-specific positive and negative values |
Dimensionless |
Represents the pressure or suction acting on the panel and support geometry. |
Use coefficients appropriate to panel tilt, clearance, edge zones, array spacing, parapets, and roof or ground mounting conditions. |
| Tributary area, At |
Panel or support tributary area |
m² |
Converts pressure into force: F = pAt. |
Use separate tributary areas for panels, rails, clamps, posts, anchors, and foundations where load paths differ. |
2. Exposure Categories and Terrain Descriptions
| Exposure |
Terrain Description |
Representative Site Conditions |
Relative Wind Profile |
Selection Caution |
| B |
Urban and suburban areas, wooded areas, or other terrain with numerous closely spaced obstructions. |
Residential districts, mature forest, low-rise urban development, and dense mixed vegetation. |
Generally lower near-ground wind speed because of greater surface roughness. |
Buildings or trees must be sufficiently extensive in the upwind direction; isolated obstructions do not automatically establish Exposure B. |
| C |
Open terrain with scattered obstructions generally less than 9.1 m high. |
Open fields, grassland, farmland, lightly developed industrial areas, and flat rural sites. |
Higher wind speed near the ground than Exposure B. |
Often governs solar arrays located in open agricultural, industrial, or undeveloped areas. |
| D |
Flat, unobstructed areas directly exposed to wind flowing over large bodies of water. |
Coastal areas, shorelines, tidal flats, and smooth open terrain adjacent to large water surfaces. |
Typically the highest near-ground wind profile among the three categories. |
Apply only where the required unobstructed fetch and shoreline conditions are satisfied. |
3. Velocity-Pressure Coefficient Kz by Exposure and Array Height
| Exposure |
Power-Law Parameters Used |
Array Height: 4.6 m
(15 ft) |
Array Height: 9.1 m
(30 ft) |
Array Height: 13.7 m
(45 ft) |
Interpretation |
| B |
α = 7.0; zg = 365.8 m (1,200 ft) |
0.58 |
0.70 |
0.79 |
Lower roughness height coefficient for built-up or wooded terrain. |
| C |
α = 9.5; zg = 274.3 m (900 ft) |
0.85 |
0.98 |
1.07 |
Common governing condition for arrays in open terrain. |
| D |
α = 11.5; zg = 213.4 m (700 ft) |
1.03 |
1.16 |
1.25 |
Highest coefficient in this comparison because of very smooth, unobstructed terrain. |
Kz calculation used for the comparison:
Kz = 2.01(z / zg)2/α, with z and zg expressed in the same units.
The displayed values are rounded examples based on commonly used open-terrain exposure parameters and should be checked against the edition of the governing design standard.
4. Example Design Velocity Pressure at a 9.1 m (30 ft) Array Height
| Case |
Wind Speed V |
Exposure |
Kz |
Kzt |
Kd |
Calculated qh |
Use of Result |
| Moderate open-site example |
30 m/s |
C |
0.98 |
1.00 |
0.85 |
0.46 kPa |
Multiply by the applicable gust and pressure coefficients to obtain panel or support design pressure. |
| Higher-wind open-site example |
40 m/s |
C |
0.98 |
1.00 |
0.85 |
0.82 kPa |
Wind pressure increases with the square of wind speed; a 33% speed increase produces approximately 78% higher pressure. |
| Coastal smooth-terrain example |
40 m/s |
D |
1.16 |
1.00 |
0.85 |
0.97 kPa |
Illustrates the increased pressure caused by a smoother upwind terrain profile. |
5. Final Array Force Calculation Example
| Calculation Item |
Example Value |
Unit |
Formula or Application |
| Reference velocity pressure |
0.82 |
kPa |
qh for V = 40 m/s, Exposure C, z = 9.1 m, Kzt = 1.00, and Kd = 0.85. |
| Gust-effect factor |
0.85 |
Dimensionless |
G = 0.85 for the illustrative rigid-component assumption. |
| Net pressure coefficient |
1.30 |
Dimensionless |
Illustrative net pressure coefficient; the actual value must reflect panel tilt, edge location, spacing, and mounting configuration. |
| Resulting design pressure |
0.91 |
kPa |
p = qhGCp = 0.82 × 0.85 × 1.30 ≈ 0.91 kPa. |
| Tributary area per support |
2.40 |
m² |
Illustrative area assigned to one post or support line. |
| Resulting horizontal or uplift force |
2.18 |
kN |
F = pAt = 0.91 × 2.40 ≈ 2.18 kN, before load-path and combination checks. |
Values in the example are for transparent calculation illustration only. Final solar-array design must use the governing wind-speed map, exposure definition, topographic procedure, pressure coefficients, load combinations, importance or risk category, panel geometry, support layout, connection strength, and foundation criteria required by the applicable building and structural standards.
Apply Pressure Coefficients to Calculate Panel and Mounting-System Loads
Wind load on a solar panel is not controlled by wind speed alone. Pressure coefficients convert wind pressure into realistic forces on the panel and mounting system. Use the design wind speed required by local structural regulations. In SI units, basic velocity pressure can be estimated as q = 0.613V², where V is wind speed in meters per second. Then apply the appropriate external pressure coefficient, Cp, to each panel surface.
The net pressure is commonly calculated as p = q(Cpe − Cpi), including external and internal effects where applicable. Positive pressure pushes the panel downward or sideways. Negative pressure creates uplift, especially near roof edges and corners. Multiply net pressure by the panel area to obtain the overall force. Check the tributary area carried by each rail, clamp, post, and anchor. A small edge panel may experience a larger coefficient than a central panel.
Field inspections often reveal uneven roof surfaces, loose fasteners, and unexpected gaps beneath modules. These details can change airflow. A neat spreadsheet can still be wrong. Verify coefficient values, exposure categories, roof geometry, and load combinations against the governing code. Then check bending, shear, pull-out, and connection capacity. Conservative assumptions help, but excessive assumptions may distort the design. A qualified structural engineer should review unusual roofs, elevated arrays, and sites with strong turbulence.
Conclusion
How to calculate wind load for solar panel mounting systems begins with establishing the site’s basic wind speed using China’s GB 50009 standard and applicable regional climate data. This value should then be converted into design wind pressure using the formula q = 0.613V², where V represents wind speed. The calculation must also consider the array’s installation height, terrain and exposure conditions, local topography, and gust effects, since these factors can significantly change the wind action on the system.
Next, apply suitable pressure coefficients to estimate the forces acting on the panels, rails, supports, and connections. Both positive pressure and uplift should be evaluated, along with potential sliding, overturning, and anchor tension or shear forces. The final design should compare these loads with the capacity of each structural component and include appropriate safety factors. A complete assessment helps ensure that the mounting system remains stable and reliable under the governing wind conditions at the project site.

 Illumino Solar